
Use loop and random library to draw the following shape.


Use loop and random library to draw the following shape.
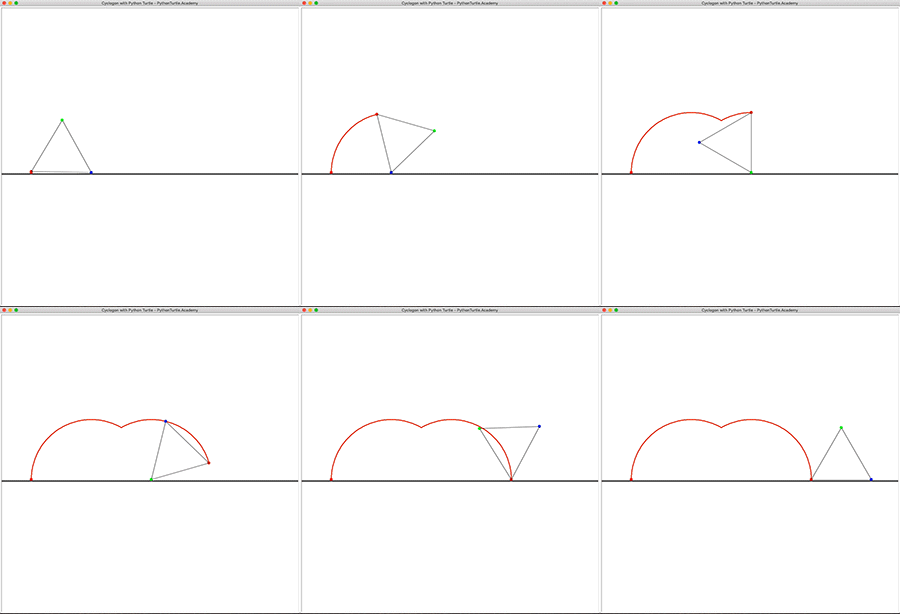
Cyclogon is a curve formed by tracing a vertex of a rolling polygon on a flat ground. Continue from previous rolling triangle animation and trace the red vertex to draw
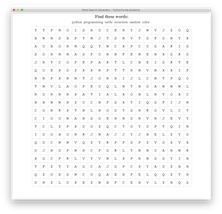
You created a random letter matrix in a previous project. Write a program that generates a random word search table given a list of words. You will practice list, string
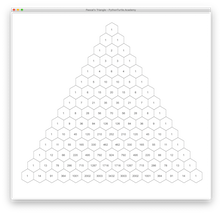
In Pascal’s Triangle, the value of a cell is the sum of its two shoulders. It has many fun properties. You drew a triangular stack of hexagons before. Now fill