
Use recursion to draw the following Box Fractal shape.


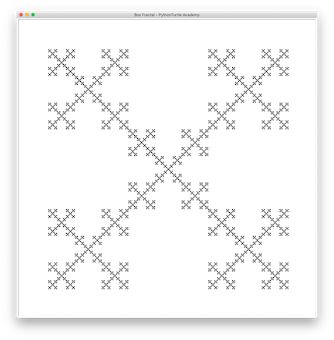
Use recursion to draw the following Box Fractal shape.
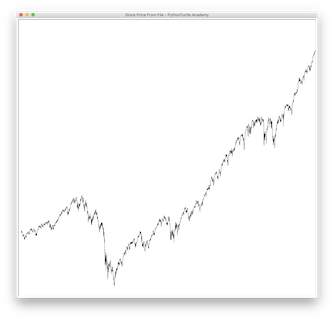
Download historical stock prices for Google, Apple, and SPY. Read the file and draw the stock charts for these companies. The following figures show the stock prices for these companies:
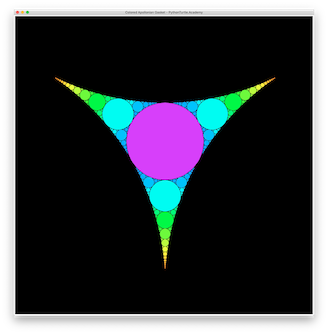
Draw the Apollonian Gasket with colors:
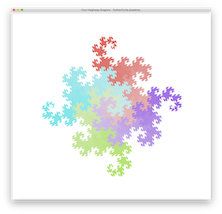
Jurassic Park Dragons can align perfectly. Draw four dragons as shown here. Related Projects: Jurassic Park Dragon Colored Jurassic Park Dragon