
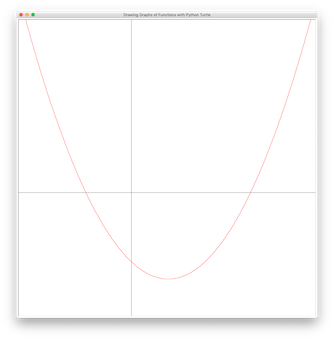
Draw graphs of functions with Python Turtle. Hint: use Turtle’s setworldcoordinates() function. The following is graphs of some selected functions:


Draw graphs of functions with Python Turtle. Hint: use Turtle’s setworldcoordinates() function. The following is graphs of some selected functions:
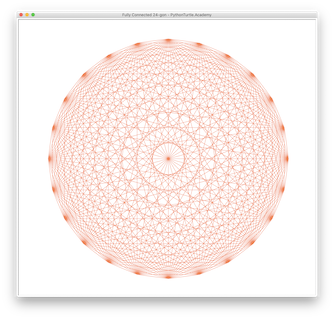
Refer to fully connected octagon before drawing this fully connected 24-gon.
You drew an oval with four centers. The radius of the red arc doesn’t have to be twice the radius of blue arc. Start from the same radius as the
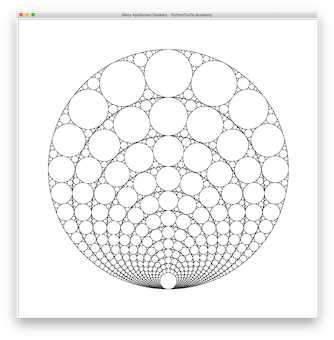
The following picture consists of Apollonian Gaskets inside a circle of another Apollonian Gasket.