
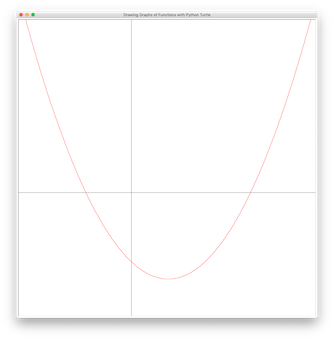
Draw graphs of functions with Python Turtle. Hint: use Turtle’s setworldcoordinates() function. The following is graphs of some selected functions:


Draw graphs of functions with Python Turtle. Hint: use Turtle’s setworldcoordinates() function. The following is graphs of some selected functions:
An ellipse is a curve surrounding two focal points such that the sum of the distances to the two focal points is constant for every point on the curve. You drew
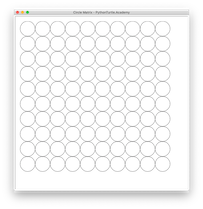
In this simple python turtle project, you are going to draw a 10×10 matrix of connected circles. You can either use nested loops or define a function that draws a
