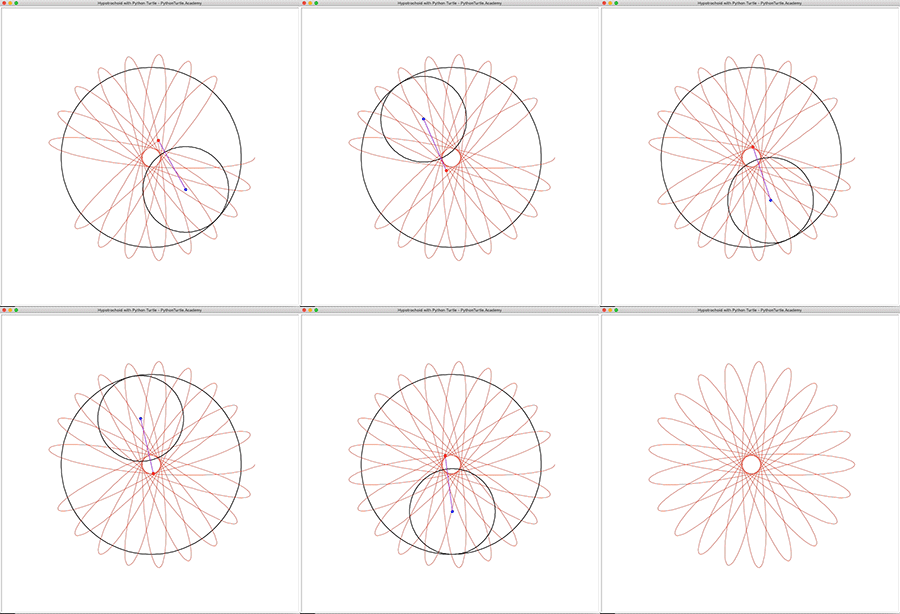
Hypotrochoid is a curve very similar to Hypocycloid. But it is more general than Hypocycloid because the point we are tracing doesn’t have to lie on the circle. It can be inside or outside the circle, making it possible to create more interesting curves. The following is a few Hypotrochoid curves created with Python Turtle:


Solution:
import turtle
import math

screen = turtle.Screen()
screen.setup(1000,1000)
screen.title("Hypotrochoid with Python Turtle - PythonTurtle.Academy")
screen.tracer(0,0)

turtle.speed(0)
turtle.hideturtle()
turtle.up()
turtle.pensize(2)
t = turtle.Turtle()
t.up()
t.hideturtle()
t.speed(0)
tt = turtle.Turtle()
tt.hideturtle()
tt.speed(0)
first = True

r_big=300
r_small=r_big/2.1
d = r_big/1.6

t3 = turtle.Turtle()
t3.hideturtle()
t3.speed(0)
t3.pensize(2)
t3.up()
t3.seth(0)
t3.goto(0,-r_big)
t3.down()
t3.circle(r_big,steps=200)

tt.up()
tt.pensize(1)
tt.color('red')
first = True

def draw_circle(x,y,angle):
    global first
    turtle.clear()
    turtle.up()
    turtle.seth(0)
    turtle.goto(x,y-r_small)
    turtle.down()
    turtle.color('black')
    turtle.circle(r_small,steps=200)
    turtle.up()
    turtle.goto(x,y)
    turtle.dot(10,'blue')
    turtle.down()
    turtle.seth(angle)
    turtle.color('purple')
    turtle.fd(d)
    turtle.dot(10,'red')
    tt.goto(turtle.xcor(),turtle.ycor())
    if first:
        tt.down()
        first = False

angle = 0
dist = -r_small*angle*math.pi/180
big_radian = dist/r_big
x = (r_big-r_small)*math.cos(big_radian)
y = (r_big-r_small)*math.sin(big_radian)
draw_circle(x,y,angle+big_radian*180/math.pi)
while True:
    angle -= 6
    dist = -r_small*angle*math.pi/180
    big_radian = dist/r_big
    x = (r_big-r_small)*math.cos(big_radian)
    y = (r_big-r_small)*math.sin(big_radian)
    draw_circle(x,y,angle+big_radian*180/math.pi)
    if angle % 360 == 0 and int(round(big_radian*180/math.pi)) % 360 == 0:
        break
    turtle.update()

turtle.clear()
t3.clear()
turtle.update()
What’s next?
Spiralgraph


