Improve your previous work on simple timer and draw a millisecond timer.
Related Work:
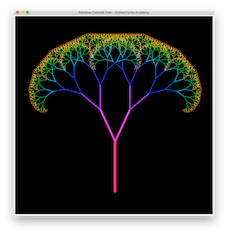
In this python turtle project, you are going to draw a beautifully colored tree with recursion. Related Projects: Tree Rainbow Colored Tree Animation Solution
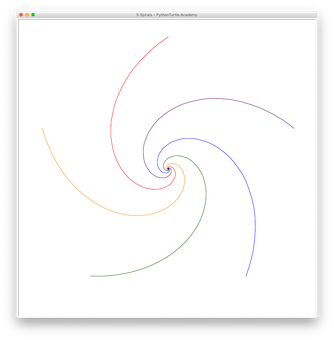
Modify pentagon spiral to draw 5 spirals as shown here. Source Code: