Animate a moving cart with a smiley inside 🙂
Related Projects:
Animate a moving cart with a smiley inside 🙂
Related Projects:
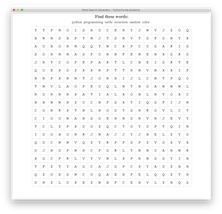
You created a random letter matrix in a previous project. Write a program that generates a random word search table given a list of words. You will practice list, string
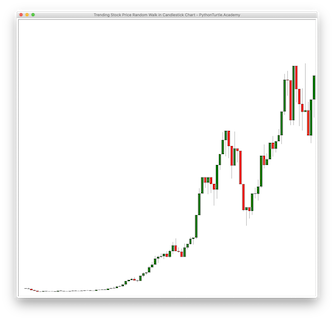
In a previous project, we draw a trending stock price random walk chart. Candlestick chart is a more common way of representing stock price chart. Modify the code for the previous project to draw