
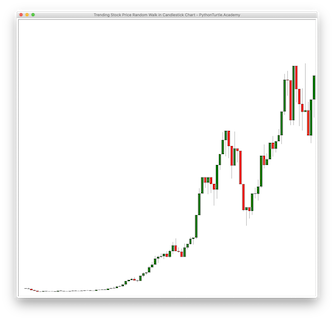
In a previous project, we draw a trending stock price random walk chart. Candlestick chart is a more common way of representing stock price chart. Modify the code for the previous project to draw
Day: October 10, 2020
Stock Price Random Walk with Candlestick ChartStock Price Random Walk with Candlestick Chart
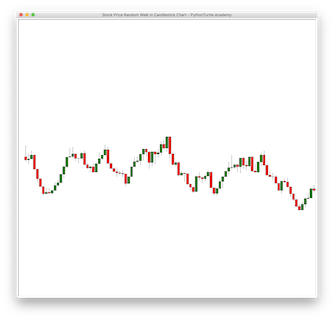
In a previous project, we draw a stock price random walk chart. Candlestick chart is a more common way of representing stock price chart. Modify the code for the previous
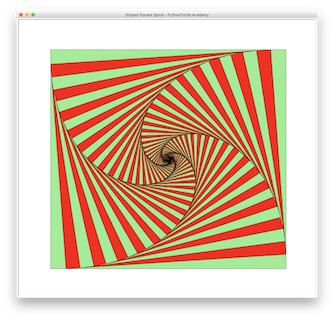
Striped Square SpiralStriped Square Spiral
In a previous project, you coded a square spiral inside squares. Make minor changes to make it a striped spiral as shown here.
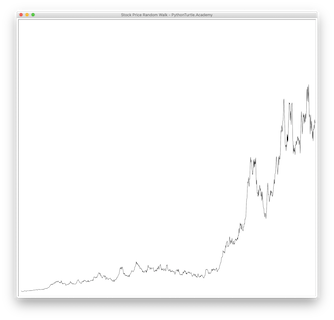
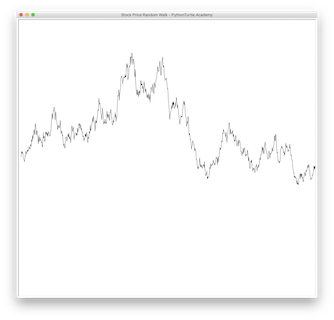
Stock Price Random Walk with Positive MeanStock Price Random Walk with Positive Mean
In this project, you simulated stock price random walk with mean equal to 0%. What if we increase the mean of Gaussian distribution very slightly to 0.5% and also increase
Stock Price Random Walk (Source Code)Stock Price Random Walk (Source Code)
In a previous project, we simulated a random walk on a 2-D plane. For this project, simulate stock price change with random walk. Start with an initial stock price. At