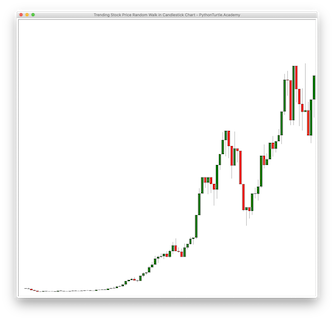
In a previous project, we draw a trending stock price random walk chart. Candlestick chart is a more common way of representing stock price chart. Modify the code for the previous project to draw
Author: J & J Coding Adventure
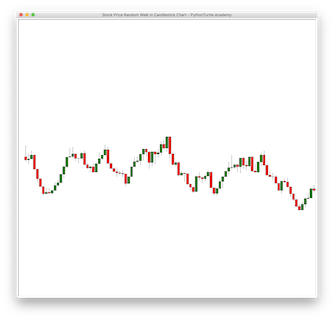
Stock Price Random Walk with Candlestick ChartStock Price Random Walk with Candlestick Chart
In a previous project, we draw a stock price random walk chart. Candlestick chart is a more common way of representing stock price chart. Modify the code for the previous
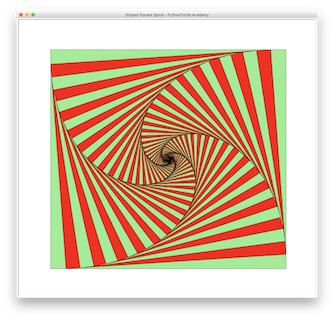
Striped Square SpiralStriped Square Spiral
In a previous project, you coded a square spiral inside squares. Make minor changes to make it a striped spiral as shown here.
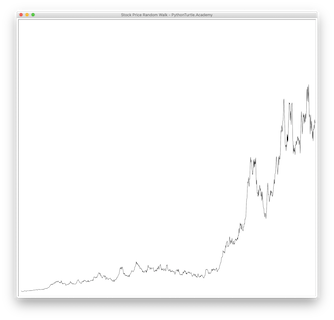
Stock Price Random Walk with Positive MeanStock Price Random Walk with Positive Mean
In this project, you simulated stock price random walk with mean equal to 0%. What if we increase the mean of Gaussian distribution very slightly to 0.5% and also increase
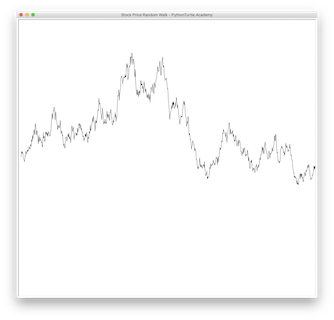
Stock Price Random Walk (Source Code)Stock Price Random Walk (Source Code)
In a previous project, we simulated a random walk on a 2-D plane. For this project, simulate stock price change with random walk. Start with an initial stock price. At
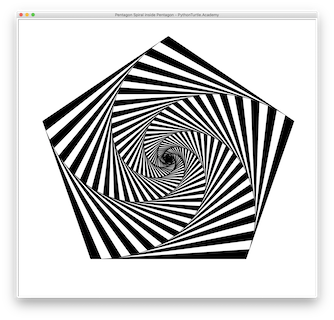
Striped Pentagon SpiralsStriped Pentagon Spirals
In a previous project, we draw a pentagon spiral inside pentagons. Based on the solution, draw a striped pentagon spirals as shown with Python and Turtle. The modification to the
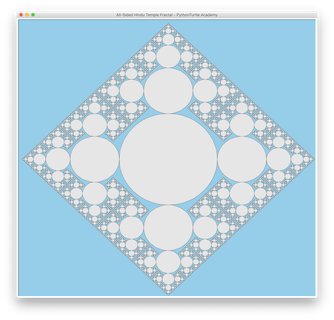
Hindu Temple (All-Sided) Fractal with Python TurtleHindu Temple (All-Sided) Fractal with Python Turtle
Draw all-sided hindu temple fractal. Refer to this Hindu Temple project.
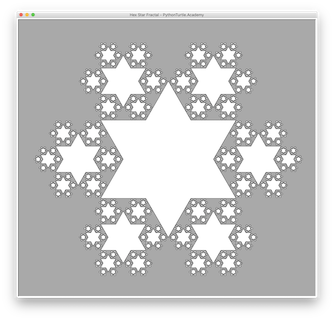
Hex Star Fractal using Python and TurtleHex Star Fractal using Python and Turtle
Draw the following fractal of hex stars using Python and Turtle. First, design a function that draws hex star in any position and size.

Hex Star with Python and TurtleHex Star with Python and Turtle
Draw a hex star as shown with Python and Turtle. Practice using loop to draw this shape.
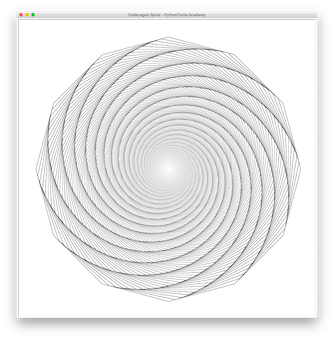
Dodecagon Spiral (Source Code)Dodecagon Spiral (Source Code)
In other related projects, we draw a pentagon spiral and a square spiral. Now draw a dodecagon spiral with 12 sides. Also make the grayscale of dodecagons gradually grow lighter

