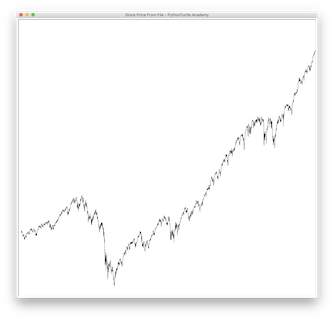
Download historical stock prices for Google, Apple, and SPY. Read the file and draw the stock charts for these companies. The following figures show the stock prices for these companies:


Source Code:
import turtle

with open('spy.us.txt','r') as fin:
    lines = fin.readlines()
n = len(lines)-1
prices = [None]*n
for i in range(1,len(lines)):
    row = lines[i].split(',')
    prices[i-1] = float(row[4])
minprice, maxprice = min(prices),max(prices)

screen = turtle.Screen()
screen.title('Stock Price From File - PythonTurtle.Academy')
screen.setup(1000,1000)
screen.setworldcoordinates(0,minprice*0.9,n,maxprice*1.1)
turtle.speed(0)
turtle.hideturtle()
turtle.up()
turtle.goto(0,prices[0])
turtle.down()
for i in range(1,n):
    turtle.goto(i,prices[i])