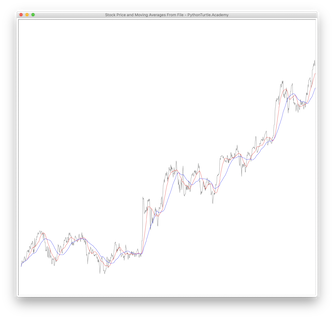
In a previous project we draw real stock price charts by reading data from files. We also draw stock moving averages in this project. Download historical stock prices for Google, Apple, and SPY and draw 20-day and 50-day moving averages for the last 1000 trading days.


Source Code:
import turtle

with open('googl.us.txt','r') as fin:
    lines = fin.readlines()
n = min(len(lines)-1,1000)
lines = lines[-n:]
prices = [None]*n
mva1 = [None]*n
mva2 = [None]*n
p1 = 20
p2 = 50

for i in range(1,n+1):
    row = lines[i-1].split(',')
    prices[i-1] = float(row[4])
    mva1[i-1] = sum(prices[max(0,i-p1):i])/min(p1,i)
    mva2[i-1] = sum(prices[max(0,i-p2):i])/min(p2,i)
minprice, maxprice = min(prices),max(prices)

screen = turtle.Screen()
screen.title('Stock Price and Moving Averages From File - PythonTurtle.Academy')
screen.setup(1000,1000)
screen.setworldcoordinates(0,minprice*0.9,n,maxprice*1.1)

turtle.speed(0)
turtle.hideturtle()
turtle.color('gray')
turtle.up()
turtle.goto(0,prices[0])
turtle.down()
tm1 = turtle.Turtle()
tm2 = turtle.Turtle()
tm1.hideturtle()
tm2.hideturtle()
tm1.color('red')
tm2.color('blue')
tm1.up()
tm1.goto(0,mva1[0])
tm1.down()
tm2.up()
tm2.goto(0,mva2[0])
tm2.down()
for i in range(1,n):
    turtle.goto(i,prices[i])
    tm1.goto(i,mva1[i])
    tm2.goto(i,mva2[i])