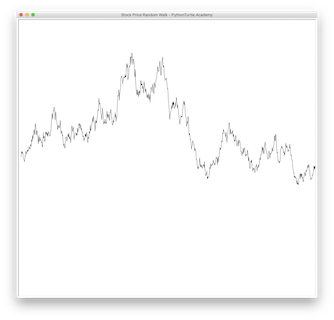
In a previous project, we simulated a random walk on a 2-D plane. For this project, simulate stock price change with random walk. Start with an initial stock price. At next day, the price change by random percentage with Gaussian (Normal) distribution (random.gauss() function) with mean 0% and standard deviation of 2%. Try to simulate multiple times and see if they look similar to some of stock price charts you have seen before.


Source Code:
import turtle
import random

screen = turtle.Screen()
screen.title('Stock Price Random Walk - PythonTurtle.Academy')
screen.setup(1000,1000)
screen.setworldcoordinates(0,0,1000,1000)
turtle.speed(0)
turtle.hideturtle()

price=500
turtle.up()
turtle.goto(0,price)
turtle.down()
for i in range(1,1000):
    price *= (1+random.gauss(0,0.02))
    turtle.goto(i,price)


