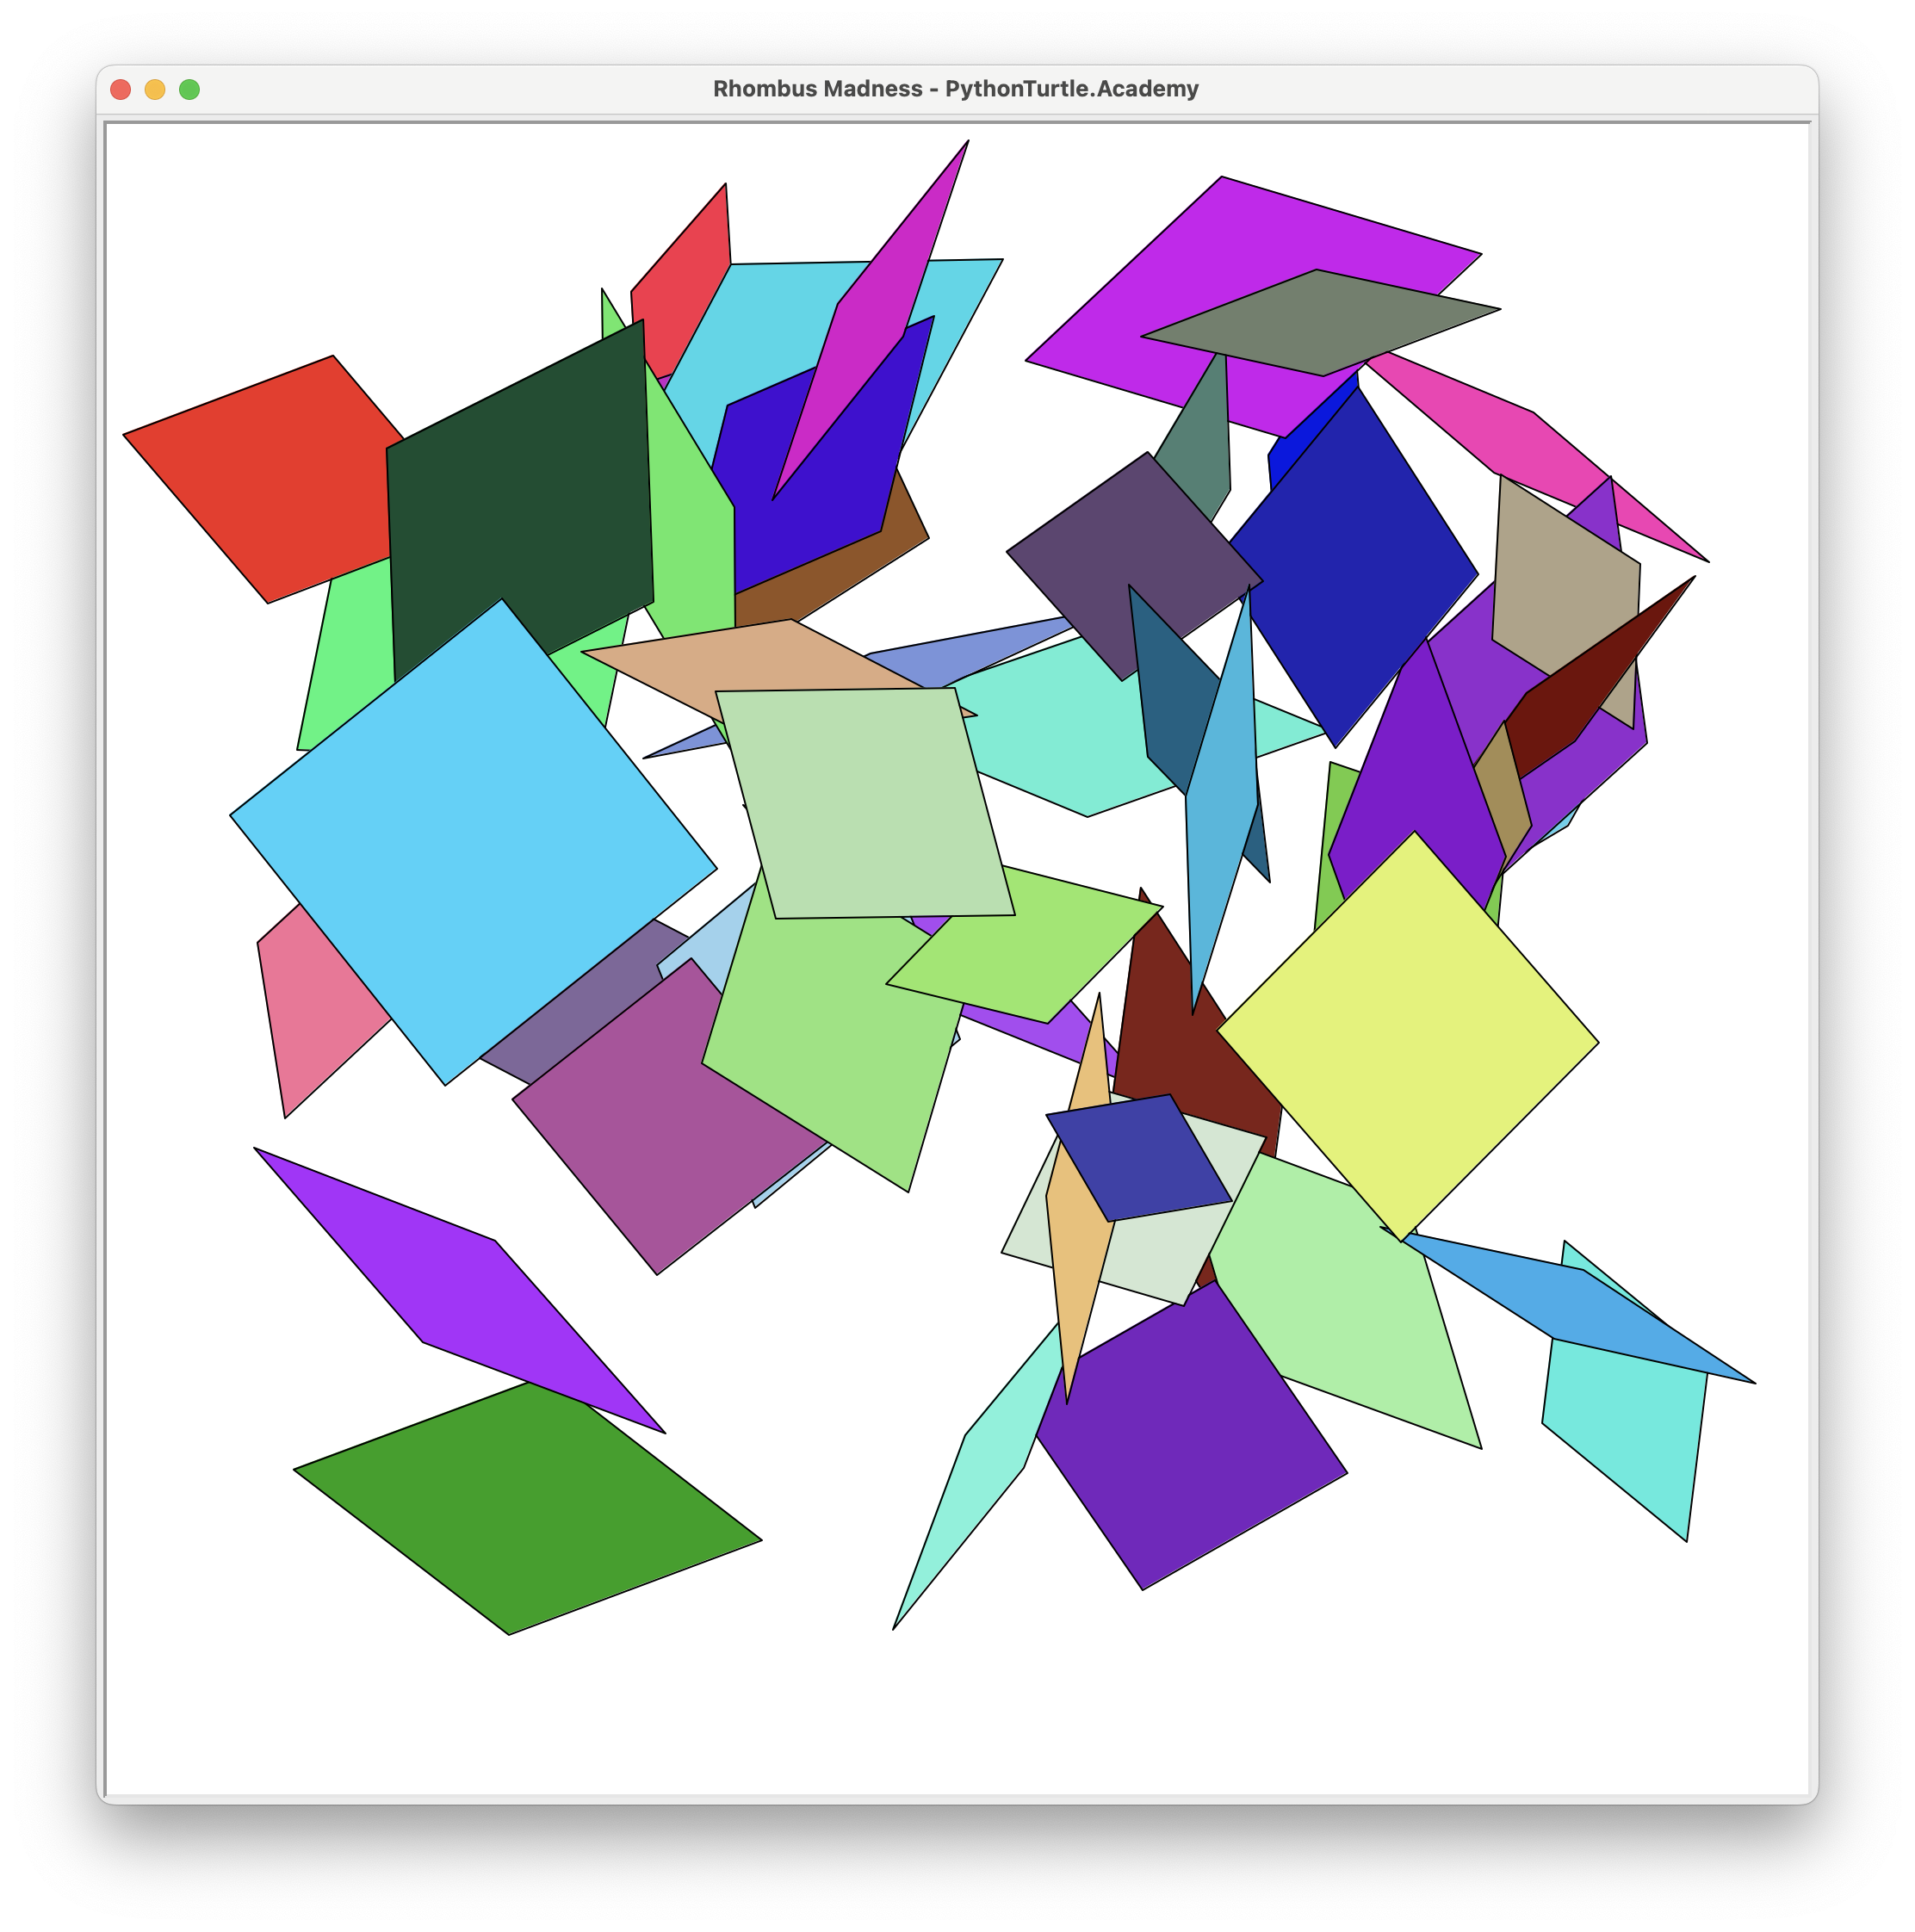
Use Python and Turtle and Random library to draw the 50 random Rhombus shapes as shown in the following figure. Hints: Make a function that draws a rhombus given the
Tag: loop
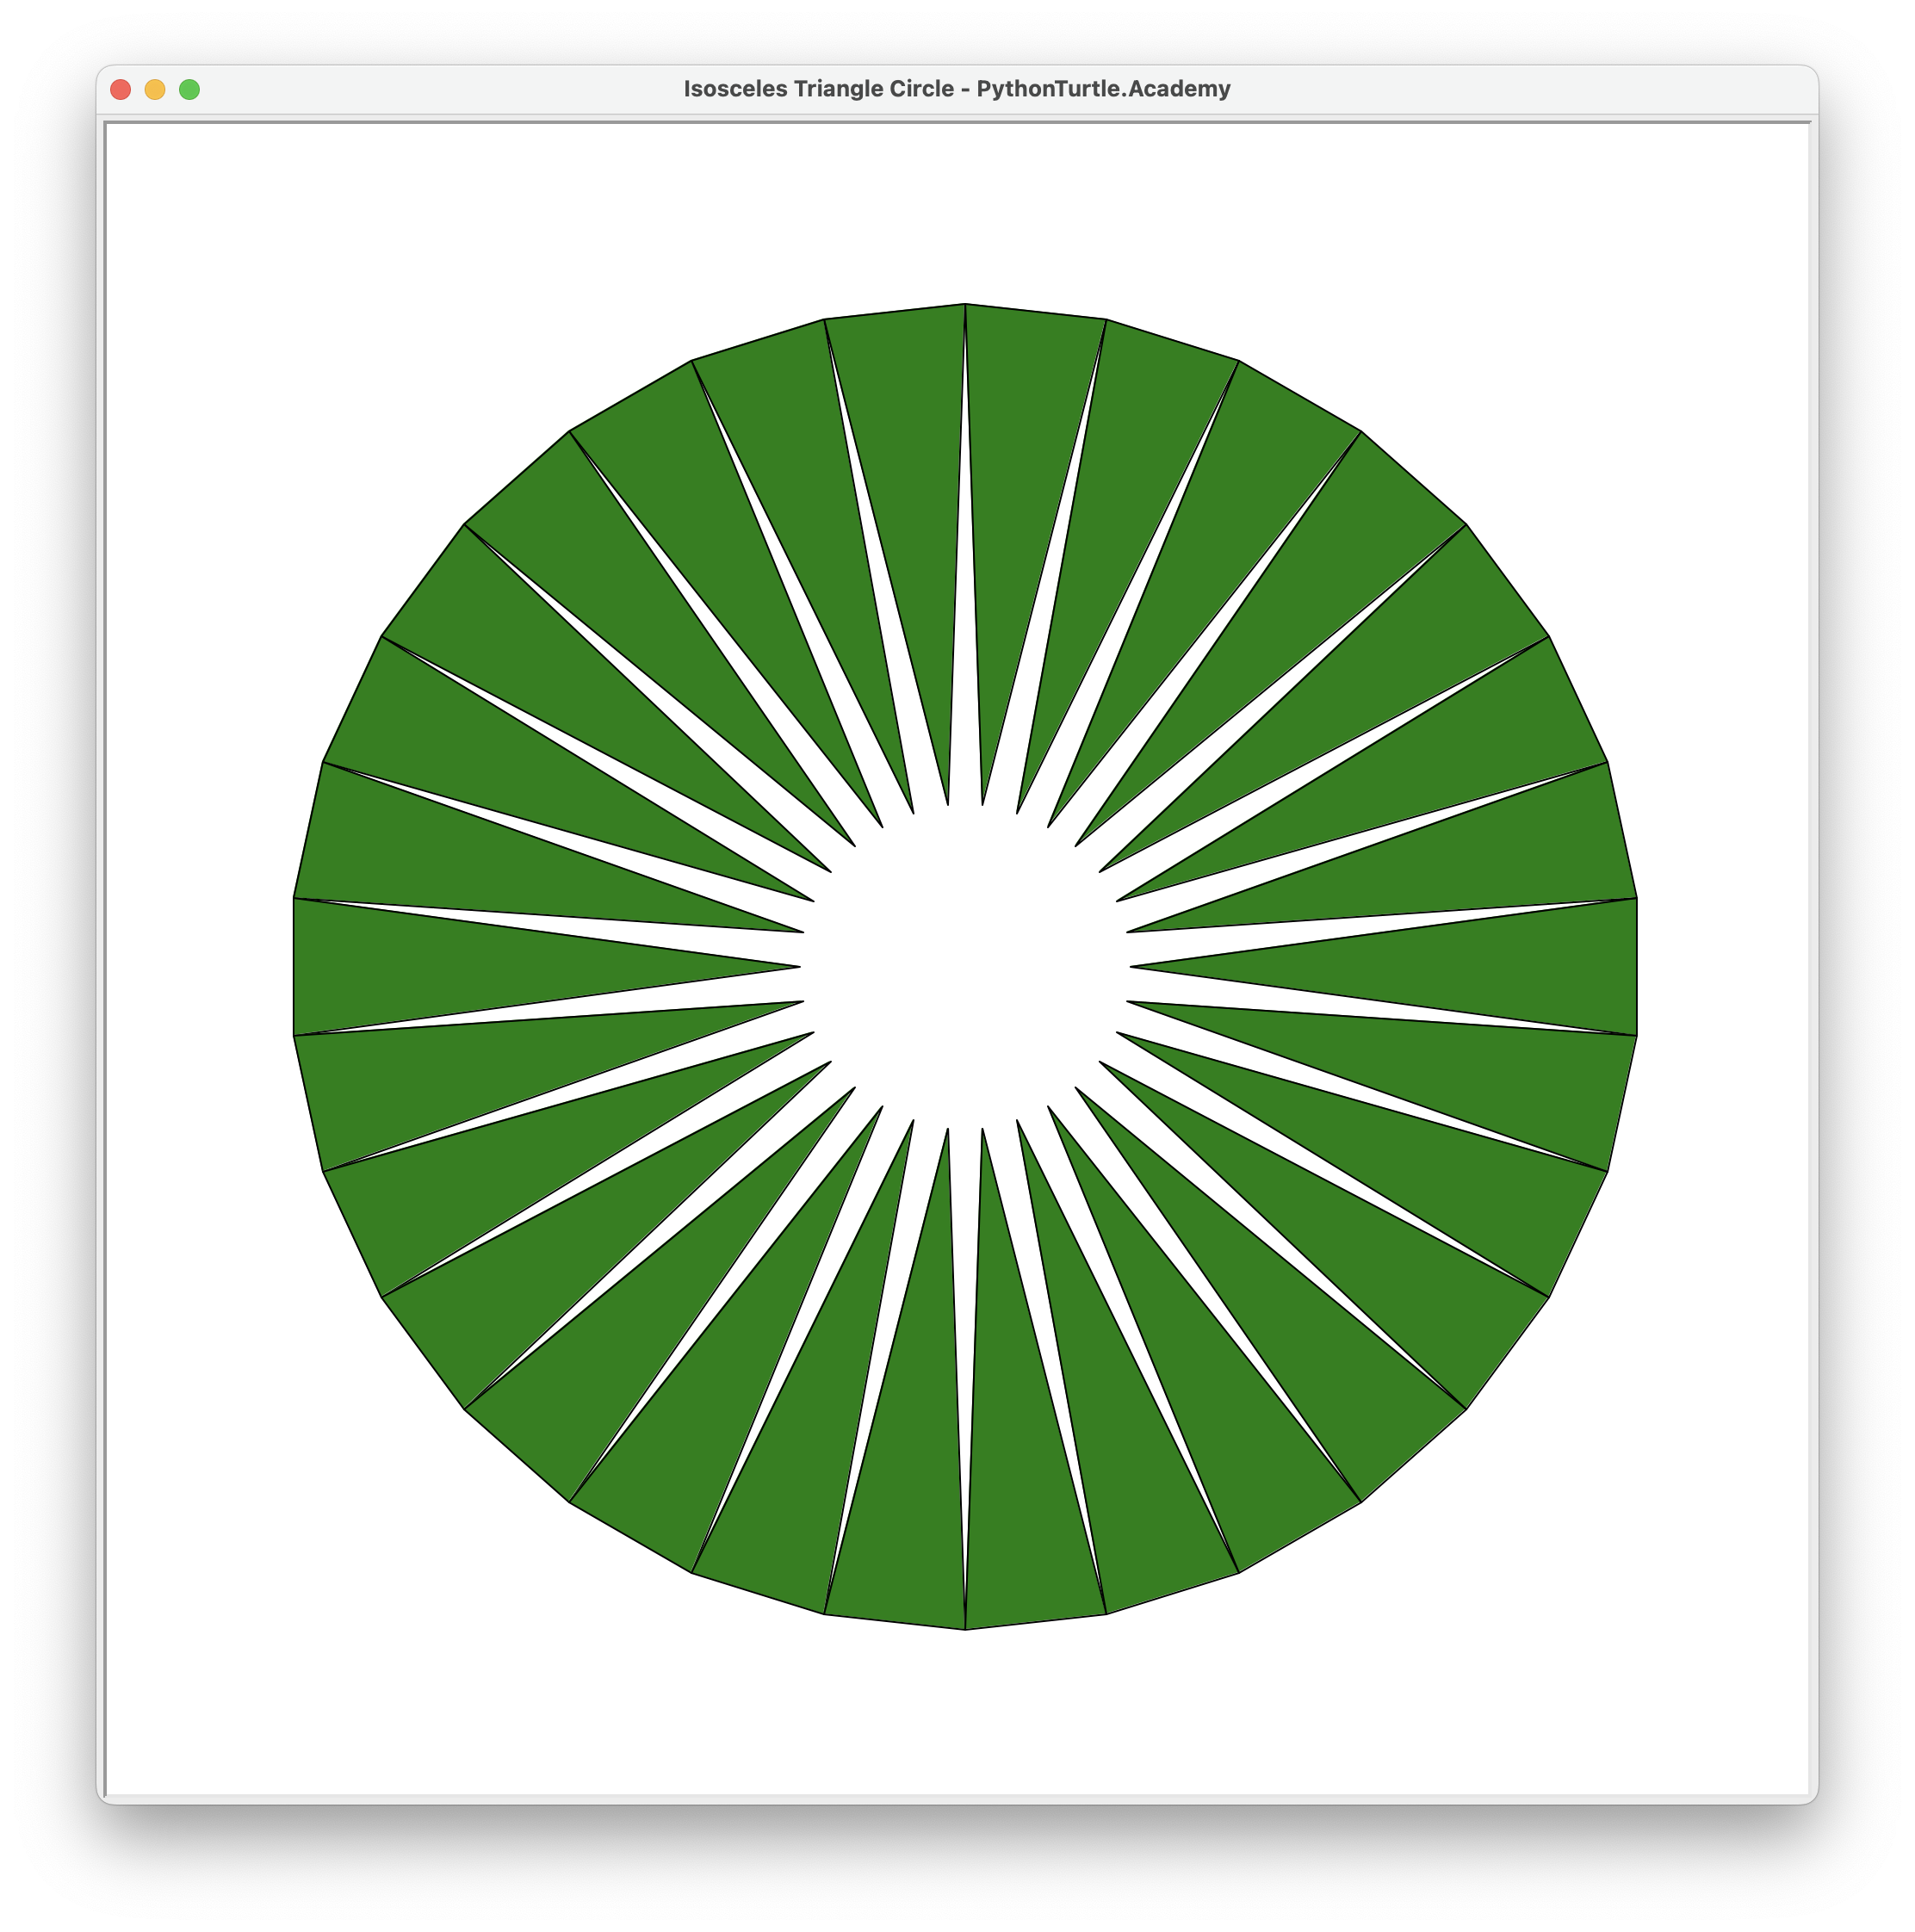
Circle of Inward Isosceles Triangles with Python and TurtleCircle of Inward Isosceles Triangles with Python and Turtle
Modify circle of isosceles triangle projects to make all triangles point inward as shown. Related Projects: Geometry Loops
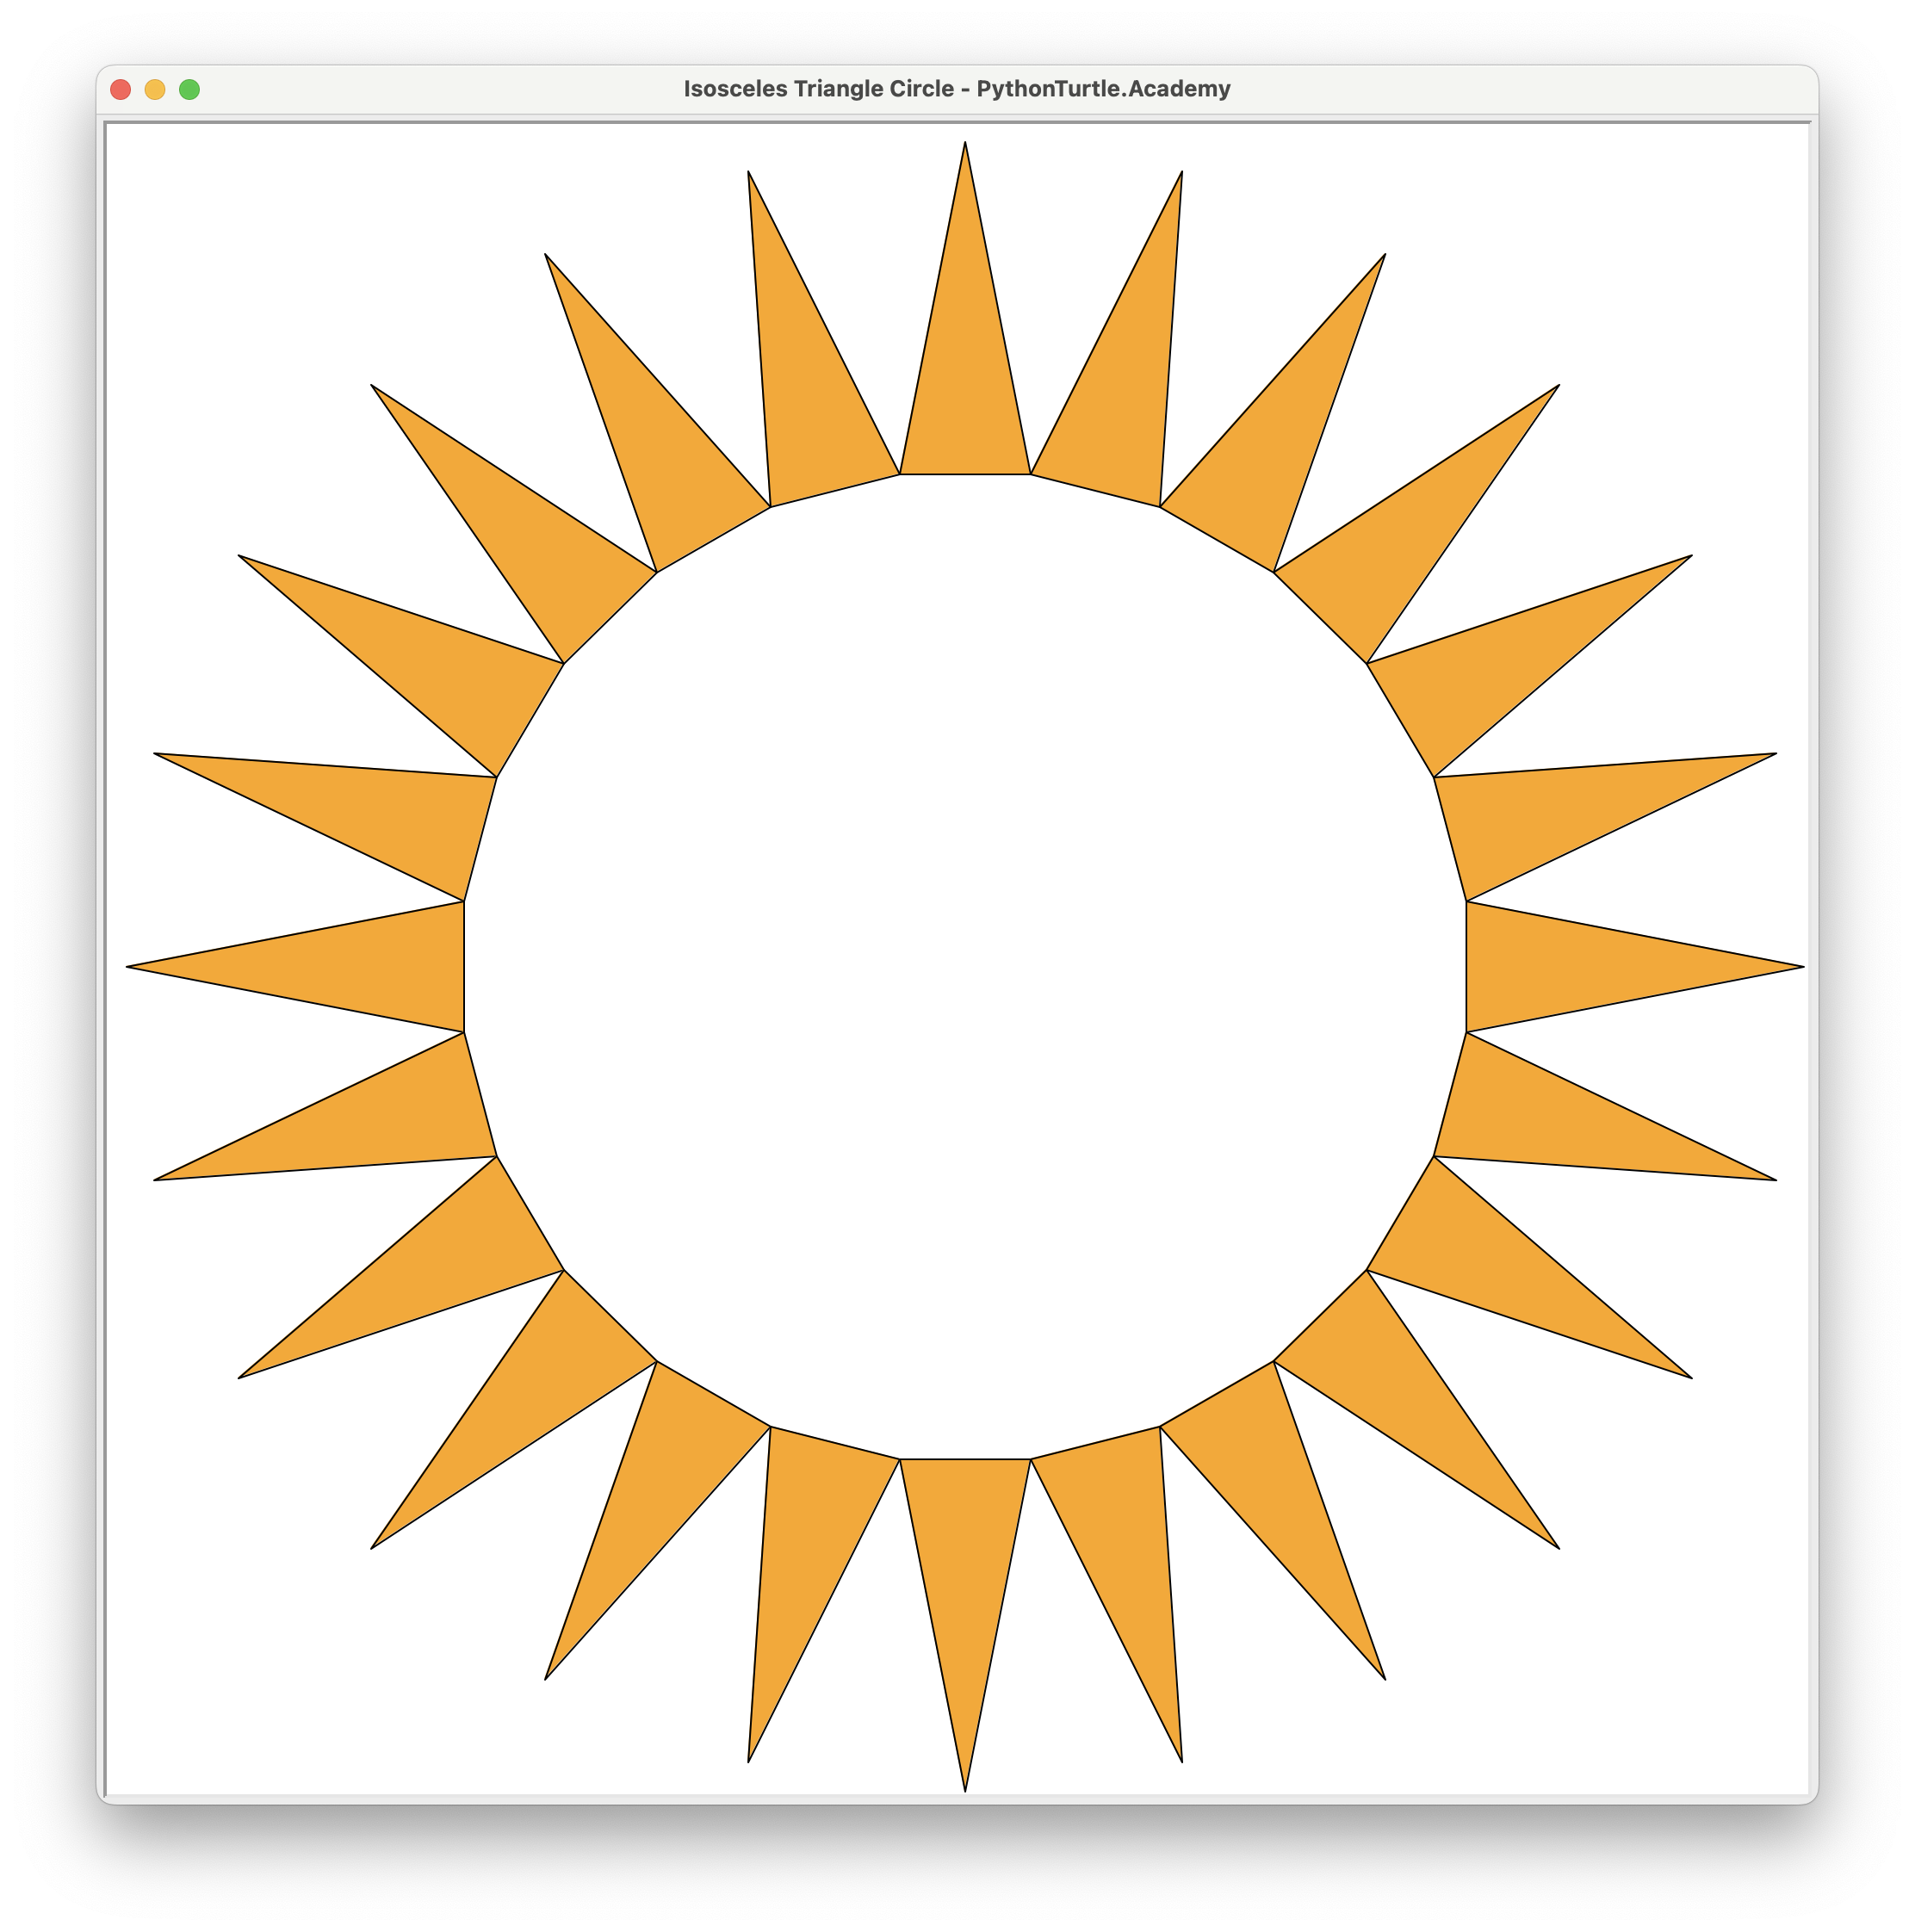
Circle of Isosceles Triangles with Python and TurtleCircle of Isosceles Triangles with Python and Turtle
Use the Isosceles triangle function created in this project, draw the circle of isosceles triangles as shown below. Your code should easily change the number of triangles, and radius and

N Overlapping Circle with Python and Turtle (Source Code)N Overlapping Circle with Python and Turtle (Source Code)
Generalize the three overlapping circles project by letting it draw any number of overlapping circles. The following is the overlapping circles from size 2 to size 7. Solution
One to Ten (Source Code)One to Ten (Source Code)
Draw from a single point to ten points that fall into a single line. Also draw dots on the end points. Source Code:
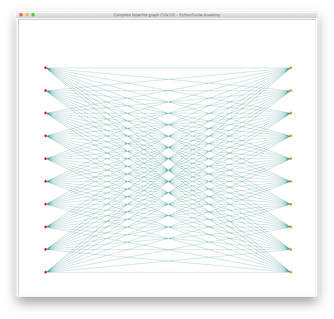
Complete Bipartite GraphComplete Bipartite Graph
A complete bipartite graph is a graph with two sets of vertices where there is no edge between vertices belonging to the same set; but all vertices of different sets
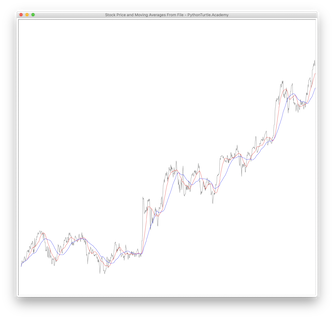
Real Stock Price Chart with Moving Averages (Source Code)Real Stock Price Chart with Moving Averages (Source Code)
In a previous project we draw real stock price charts by reading data from files. We also draw stock moving averages in this project. Download historical stock prices for Google, Apple, and SPY
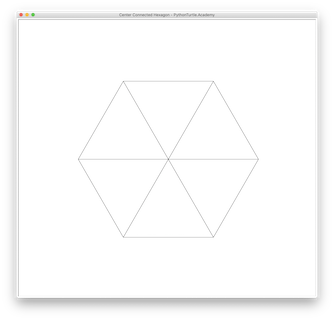
Center Connected Hexagon (Source Code)Center Connected Hexagon (Source Code)
Draw a regular hexagon that have vertices connected to the center. Use for loop to draw this shape. Source Code:
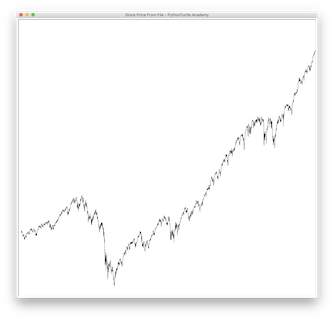
Real Stock Price Chart (GOOG, AAPL, SPY) with Source CodeReal Stock Price Chart (GOOG, AAPL, SPY) with Source Code
Download historical stock prices for Google, Apple, and SPY. Read the file and draw the stock charts for these companies. The following figures show the stock prices for these companies:

Hex Star with Python and TurtleHex Star with Python and Turtle
Draw a hex star as shown with Python and Turtle. Practice using loop to draw this shape.

