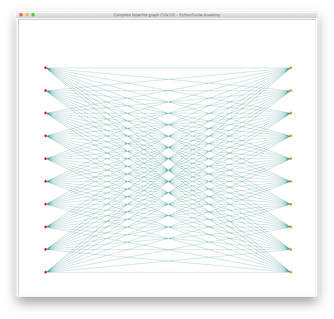
A complete bipartite graph is a graph with two sets of vertices where there is no edge between vertices belonging to the same set; but all vertices of different sets
Category: python
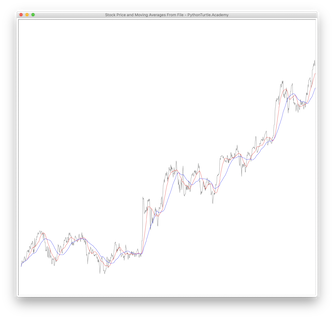
Real Stock Price Chart with Moving Averages (Source Code)Real Stock Price Chart with Moving Averages (Source Code)
In a previous project we draw real stock price charts by reading data from files. We also draw stock moving averages in this project. Download historical stock prices for Google, Apple, and SPY
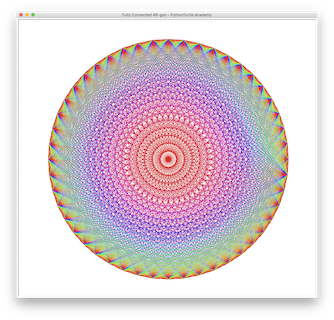
Rainbow Colored Fully Connected 48-gonRainbow Colored Fully Connected 48-gon
We have project that draws fully connected 24-gon. Use colorsys library to gradually change the hue of lines as they get longer.
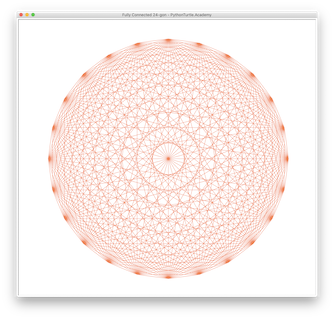
Fully Connected 24-gonFully Connected 24-gon
Refer to fully connected octagon before drawing this fully connected 24-gon.
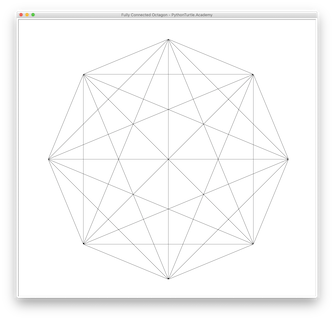
Fully Connected OctagonFully Connected Octagon
Use nested for loop and list to draw the following fully connected octagon.
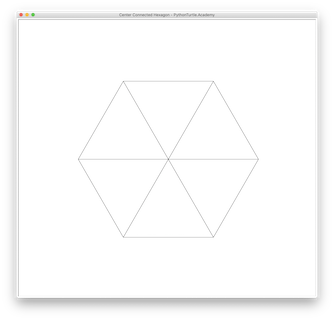
Center Connected Hexagon (Source Code)Center Connected Hexagon (Source Code)
Draw a regular hexagon that have vertices connected to the center. Use for loop to draw this shape. Source Code:
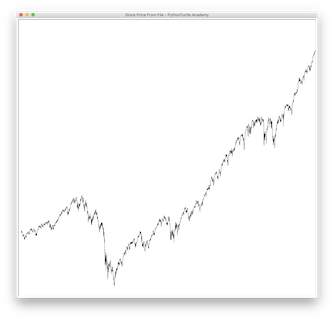
Real Stock Price Chart (GOOG, AAPL, SPY) with Source CodeReal Stock Price Chart (GOOG, AAPL, SPY) with Source Code
Download historical stock prices for Google, Apple, and SPY. Read the file and draw the stock charts for these companies. The following figures show the stock prices for these companies:
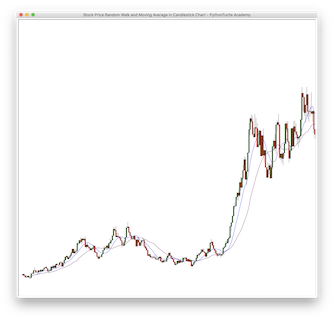
Stock Price Random Walk with Moving AveragesStock Price Random Walk with Moving Averages
Moving averages can smooth out the stock prices and reduce the randomness. Based on the previous projects (stock price random walk with candlestick chart, and trending stock price random walk
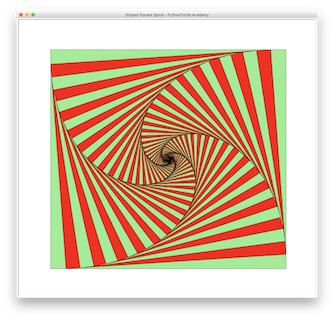
Striped Square SpiralStriped Square Spiral
In a previous project, you coded a square spiral inside squares. Make minor changes to make it a striped spiral as shown here.
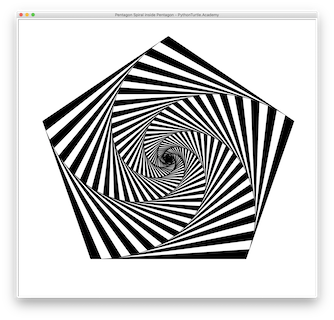
Striped Pentagon SpiralsStriped Pentagon Spirals
In a previous project, we draw a pentagon spiral inside pentagons. Based on the solution, draw a striped pentagon spirals as shown with Python and Turtle. The modification to the

