Draw from a single point to ten points that fall into a single line. Also draw dots on the end points.
One to Ten
Source Code:
import turtle

turtle.setup(1000,1000)
turtle.title('One to Ten - PythonTurtle.Academy')
turtle.speed(0)
turtle.hideturtle()

turtle.color('green')

turtle.up()
turtle.goto(0,250)
turtle.dot('red')
for x in range(-450,460,100):
    turtle.up()
    turtle.goto(0,250)
    turtle.down()
    turtle.goto(x,-250)
    turtle.dot('blue')
A complete bipartite graph is a graph with two sets of vertices where there is no edge between vertices belonging to the same set; but all vertices of different sets are fully connected. Draw the K(10,10) where each set have 10 vertices.
Draw a regular hexagon that have vertices connected to the center. Use for loop to draw this shape.
Center Connected Hexagon
Source Code:
hideturtle()
for angle in range(0,360,60):
    up()
    goto(0,0)
    seth(angle)
    down()
    fd(300)

up()
goto(300,0)
seth(120)
down()
for _ in range(6):
    fd(300)
    left(60)
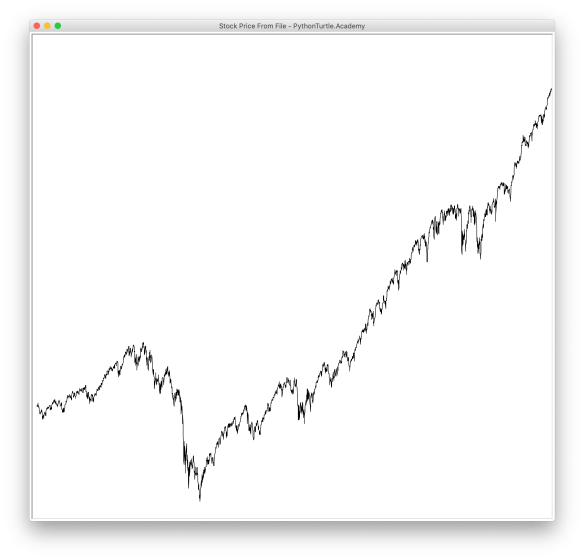
Download historical stock prices for Google, Apple, and SPY. Read the file and draw the stock charts for these companies. The following figures show the stock prices for these companies:
Stock Price Chart of GOOG from 2004 to 2016Stock Price Chart of AAPL from 1984 to 2016Stock Price Chart of SPY from 2005 to 2016
Source Code:
import turtle

with open('spy.us.txt','r') as fin:
    lines = fin.readlines()
n = len(lines)-1
prices = [None]*n
for i in range(1,len(lines)):
    row = lines[i].split(',')
    prices[i-1] = float(row[4])
minprice, maxprice = min(prices),max(prices)

screen = turtle.Screen()
screen.title('Stock Price From File - PythonTurtle.Academy')
screen.setup(1000,1000)
screen.setworldcoordinates(0,minprice*0.9,n,maxprice*1.1)
turtle.speed(0)
turtle.hideturtle()
turtle.up()
turtle.goto(0,prices[0])
turtle.down()
for i in range(1,n):
    turtle.goto(i,prices[i])
In a previous project, we draw a trending stock price random walk chart. Candlestick chart is a more common way of representing stock price chart. Modify the code for the previous project to draw stock price random walk with Candlestick Chart.
Trending Stock Price Random Walk with Candlestick ChartTrending Stock Price Random Walk with Candlestick Chart