Based on golden fractal tree project, draw the following shape that contains 5 golden fractal trees.


Based on golden fractal tree project, draw the following shape that contains 5 golden fractal trees.
Golden Fractal Tree is a tree based on Golden Ratio. The golden fractal tree contains the main branch and three smaller golden fractal trees: the first branch turns left by 72 degrees with ratio of main branch to the parent’s main branch = 2-golden_ratio; the second branch have the same the direction as the parent with ratio of main branch to the parent’s main branch = golden_ratio-1; the first branch turns right by 72 degrees with ratio of main branch to the parent’s main branch = 2-golden_ratio. For more details on golden fractal tree, please check out this web page.

Source Code:
import turtle
import math

screen = turtle.Screen()
screen.title('Golden Fractal Tree - PythonTurtle.Academy')
screen.setup(1000,1000)
screen.setworldcoordinates(-1000,-1000,1000,1000)
turtle.speed(0)
turtle.hideturtle()
turtle.tracer(0,0)
golden_ratio = (1+5**0.5)/2

def golden_fractal_tree(x,y,direction,length):
    turtle.up()
    turtle.goto(x,y)
    turtle.seth(direction)
    turtle.pensize(math.log(length,2)/3)
    if length<10: turtle.color('forest green')
    else: turtle.color('gray')
    turtle.down()
    turtle.fd(length)
    if length < 3: return
    cx,cy = turtle.xcor(), turtle.ycor()
    golden_fractal_tree(cx,cy,direction+72,(2-golden_ratio)*length)
    golden_fractal_tree(cx,cy,direction-72,(2-golden_ratio)*length)
    golden_fractal_tree(cx,cy,direction,(golden_ratio-1)*length)

golden_fractal_tree(0,-900,90,700)
turtle.update()
Use recursion to draw the following snowflake shape generated from 6 sub-fractals of splitting lines.

The following figures show recursion depths ranging from 0 to 4.


To solve this problem, you want to start from a function that draws a line given starting point (x,y), length, direction, and pensize. The following is the code for this function:
def line(x,y,length,direction,pensize):
  turtle.up()
  turtle.pensize(pensize)
  turtle.goto(x,y)
  turtle.down()
  turtle.seth(direction)
  turtle.fd(length)
Now you can define the recursive function that keeps branching out the shorter pair of lines. The starting point of the branch is about 2/5 of way from the original starting point. One branch is turning right about 25 degrees and the other branch is turning left about 25 degrees. Pen size should decrease proportionally too. The following is the code for this function:
def line_fractal(x,y,length,direction,pensize,n):
  if n==0: return
  line(x,y,length,direction,pensize)
  line_fractal(x+math.cos(direction*math.pi/180)*length*2/5,
               y+math.sin(direction*math.pi/180)*length*2/5,
               length*3/5,
               direction-25,
               pensize*3/5,
               n-1)
  line_fractal(x+math.cos(direction*math.pi/180)*length*2/5,
               y+math.sin(direction*math.pi/180)*length*2/5,
               length*3/5,
               direction+25,
               pensize*3/5,
               n-1)
The last function is the easiest. Just call the function above 6 times with 6 evenly spaced lines across 360 degrees. The following is the complete code for this project:
import turtle
import math

screen = turtle.Screen()
screen.title('6 Line Snowflake Fractal - PythonTurtle.Academy')
screen.setup(1000,1000)
screen.tracer(0,0)
turtle.hideturtle()
turtle.speed(0)

def line(x,y,length,direction,pensize):
  turtle.up()
  turtle.pensize(pensize)
  turtle.goto(x,y)
  turtle.down()
  turtle.seth(direction)
  turtle.fd(length)

def line_fractal(x,y,length,direction,pensize,n):
  if n==0: return
  line(x,y,length,direction,pensize)
  line_fractal(x+math.cos(direction*math.pi/180)*length*2/5,
               y+math.sin(direction*math.pi/180)*length*2/5,
               length*3/5,
               direction-25,
               pensize*3/5,
               n-1)
  line_fractal(x+math.cos(direction*math.pi/180)*length*2/5,
               y+math.sin(direction*math.pi/180)*length*2/5,
               length*3/5,
               direction+25,
               pensize*3/5,
               n-1)

def snowflake():
  for i in range(6):
    line_fractal(0,0,400,i*60,5,5)

snowflake()
screen.update()In a previous project we draw real stock price charts by reading data from files. We also draw stock moving averages in this project. Download historical stock prices for Google, Apple, and SPY and draw 20-day and 50-day moving averages for the last 1000 trading days.


Source Code:
import turtle

with open('googl.us.txt','r') as fin:
    lines = fin.readlines()
n = min(len(lines)-1,1000)
lines = lines[-n:]
prices = [None]*n
mva1 = [None]*n
mva2 = [None]*n
p1 = 20
p2 = 50

for i in range(1,n+1):
    row = lines[i-1].split(',')
    prices[i-1] = float(row[4])
    mva1[i-1] = sum(prices[max(0,i-p1):i])/min(p1,i)
    mva2[i-1] = sum(prices[max(0,i-p2):i])/min(p2,i)
minprice, maxprice = min(prices),max(prices)

screen = turtle.Screen()
screen.title('Stock Price and Moving Averages From File - PythonTurtle.Academy')
screen.setup(1000,1000)
screen.setworldcoordinates(0,minprice*0.9,n,maxprice*1.1)

turtle.speed(0)
turtle.hideturtle()
turtle.color('gray')
turtle.up()
turtle.goto(0,prices[0])
turtle.down()
tm1 = turtle.Turtle()
tm2 = turtle.Turtle()
tm1.hideturtle()
tm2.hideturtle()
tm1.color('red')
tm2.color('blue')
tm1.up()
tm1.goto(0,mva1[0])
tm1.down()
tm2.up()
tm2.goto(0,mva2[0])
tm2.down()
for i in range(1,n):
    turtle.goto(i,prices[i])
    tm1.goto(i,mva1[i])
tm2.goto(i,mva2[i])We have project that draws fully connected 24-gon. Use colorsys library to gradually change the hue of lines as they get longer.

Download historical stock prices for Google, Apple, and SPY. Read the file and draw the stock charts for these companies. The following figures show the stock prices for these companies:


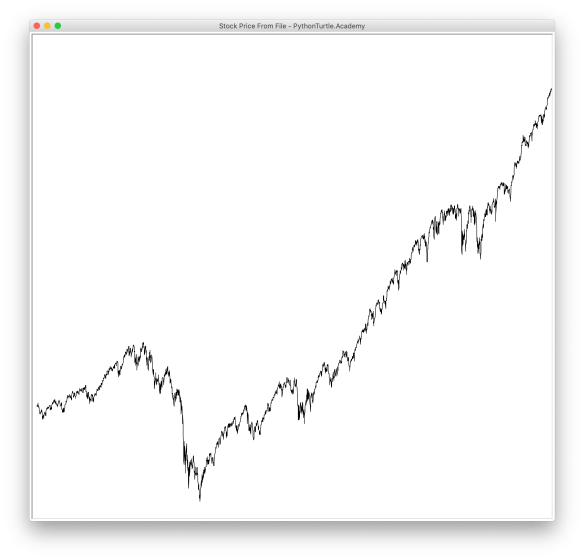
Source Code:
import turtle

with open('spy.us.txt','r') as fin:
    lines = fin.readlines()
n = len(lines)-1
prices = [None]*n
for i in range(1,len(lines)):
    row = lines[i].split(',')
    prices[i-1] = float(row[4])
minprice, maxprice = min(prices),max(prices)

screen = turtle.Screen()
screen.title('Stock Price From File - PythonTurtle.Academy')
screen.setup(1000,1000)
screen.setworldcoordinates(0,minprice*0.9,n,maxprice*1.1)
turtle.speed(0)
turtle.hideturtle()
turtle.up()
turtle.goto(0,prices[0])
turtle.down()
for i in range(1,n):
    turtle.goto(i,prices[i])
In a previous project, we draw a trending stock price random walk chart. Candlestick chart is a more common way of representing stock price chart. Modify the code for the previous project to draw stock price random walk with Candlestick Chart.


In a previous project, we draw a stock price random walk chart. Candlestick chart is a more common way of representing stock price chart. Modify the code for the previous to draw stock price random walk with Candlestick Chart.


In a previous project, we draw a pentagon spiral inside pentagons. Based on the solution, draw a striped pentagon spirals as shown with Python and Turtle. The modification to the code should be very small.


